Investors may be wondering about the performance of the stock portion of their portfolios relative to popular stock market benchmarks like the S&P 500, which is a gauge of the performance of large U.S. companies. These differences in relative performance are referred to as “tracking error.” This article reviews the factors that cause our stock fund portfolios to perform differently than the S&P 500 and explains why our portfolios are intentionally constructed to perform differently.
Sources of Tracking Error
The primary sources of tracking error relative to the S&P 500 are 1) including an allocation to international and emerging markets stocks, 2) allocating a substantial portion to small-company stocks and 3) emphasizing value stocks — which are stocks that trade at relatively low prices relative to the earnings the company is generating.
In any given year or period of years, international stocks, small company stocks and value stocks may experience significantly different performance than the S&P 500. Through November of this year, all three have experienced significantly lower returns than the S&P 500:
Figure 1: Performance From January–November 2014
| Total Returns (%) | |
| S&P 500 | 14.0 |
| International Stocks | -1.5 |
| Emerging Market Stocks | 2.5 |
| Small Company Stocks | 2.0 |
Source: Bloomberg
For international and emerging markets stocks, a large part of the performance difference has been driven by the appreciation of the U.S. dollar relative to foreign currencies. Through November, the U.S. dollar has generally appreciated by about 10 percent against foreign currencies.
The Argument for International and Emerging Markets Stocks
As Figure 1 shows, international and emerging markets stocks can have materially different performance than U.S. large company stocks, so a natural question is why include them in a portfolio? The two primary reasons are diversification across stock markets and currencies. The argument for diversification rests on two concepts. First, international and emerging markets stocks comprise about 50 percent of the world’s stock market wealth. This alone argues for a substantial allocation to international and emerging markets stocks. You would be ignoring approximately $20 trillion of publicly traded stock by excluding them. The second argument is perhaps even more compelling: No one knows which particular stock market will experience the highest (or lowest) returns in the future. If you concentrate your stock portfolio in a single country, you run the risk of that country’s stock market experiencing below-average returns over your investment lifetime. You can reduce this risk by diversifying. As Figure 2 illustrates, the performance of any single country’s equity market can be materially different from another’s even over very long periods of time.
Figure 2: Country Equity Market Performance 1900-2013
Annualized Real Returns
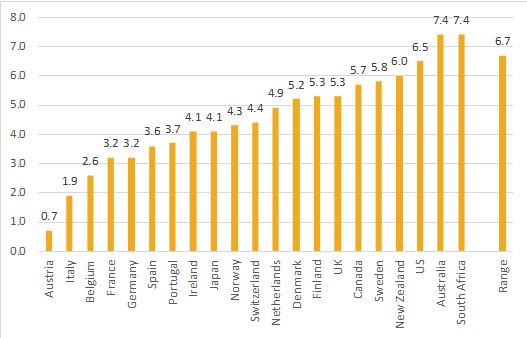
This chart shows that the annualized net-of-inflation returns varied widely across countries for a period that exceeds 100 years. While the 20th century ended up being a positive one for the U.S., no one knows whether history will repeat itself, and even over this period, Australia’s and South Africa’s stock markets experienced higher returns than the U.S. stock market. We believe the right strategy is to diversify across countries, even though in hindsight, there will almost certainly be particular countries that have higher stock market returns than a globally diversified portfolio.
Why Tilt Toward Small-Company Stocks?
Over time, small-company stocks have generated higher returns than large-company stocks. In the U.S. stock market over the period of 1927-2013, small-company stocks had average annual returns 3.6 percent higher than large-company stocks. Figure 3 shows the year-by-year variation in the return advantage of small-company stocks compared with large-company stocks. A positive bar depicts a year when small-company stocks outperformed large company stocks and vice versa.
Figure 3: Small-Company Stocks vs. Large-Company Stocks
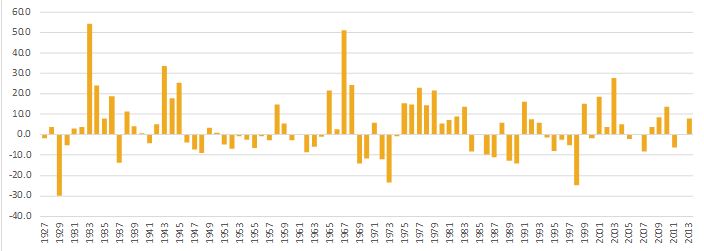 Source: Kenneth French Data Library (http://mba.tuck.dartmouth.edu/pages/faculty/ken.french/data_library.html)
As Figure 3 shows, the year-by-year performance advantage of small stocks compared with large stocks varies widely. The figure also clearly shows that there are years when small-company stocks have returns that are substantially lower than large-company stocks. In fact, in 10 of the 87 years, small-company stocks underperformed large-company stocks by 10 percent or more. This shows that being able to capture the potential long-run return advantage that small-company stocks tend to produce comes with a price. You also have to own these stocks during periods when they underperform large-company stocks because we believe it is practically impossible to forecast on a year-to-year basis whether small stocks will outperform large stocks or vice versa.
Summary
In 2014, international, emerging markets and small company stocks have earned lower returns than U.S. large-company stocks. We continue to believe, however, that the long-term historical evidence and commonsense principles of diversification argue for continuing to include these asset classes in well-diversified portfolios.
Copyright © 2014, Claris Advisors and the BAM ALLIANCE. This material and any opinions contained are derived from sources believed to be reliable, but its accuracy and the opinions based thereon are not guaranteed. The content of this publication is for general information only and is not intended to serve as specific financial, accounting or tax advice. To be distributed only by a Registered Investment Advisor firm. Information regarding references to third-party sites: Referenced third-party sites are not under our control, and we are not responsible for the contents of any linked site or any link contained in a linked site, or any changes or updates to such sites. Any link provided to you is only as a convenience, and the inclusion of any link does not imply our endorsement of the site.